Recent Data on Regional & Global Climatic Trends
This page mainly presents articles and essays that we consider to have significance for assessing this subject.
ON OUR DROUGHT:
Concerning our Southeast Arizona Drought, as of Sep. 2005:
Latest events are at left; this NOAA record begins in 1998.
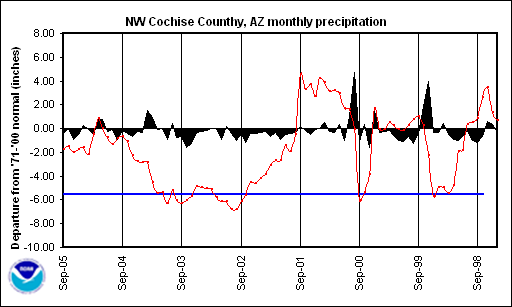
What do the above graphics show? The area shaded BLACK shows monthly precipitation departure from (1971-2000) normals. The RED line depicts 12-month total precipitation departure from normal with SURPLUSES above the zero line and DEFICITS below the zero line. The BLUE line shows what is the 60% departure of the yearly normal.
Arizona (and other Southwest) Drought, 2002-2005
Global Temperatures 2003
Seasonal Life Schedules and Global Warming
Global Warming & Global Economy